
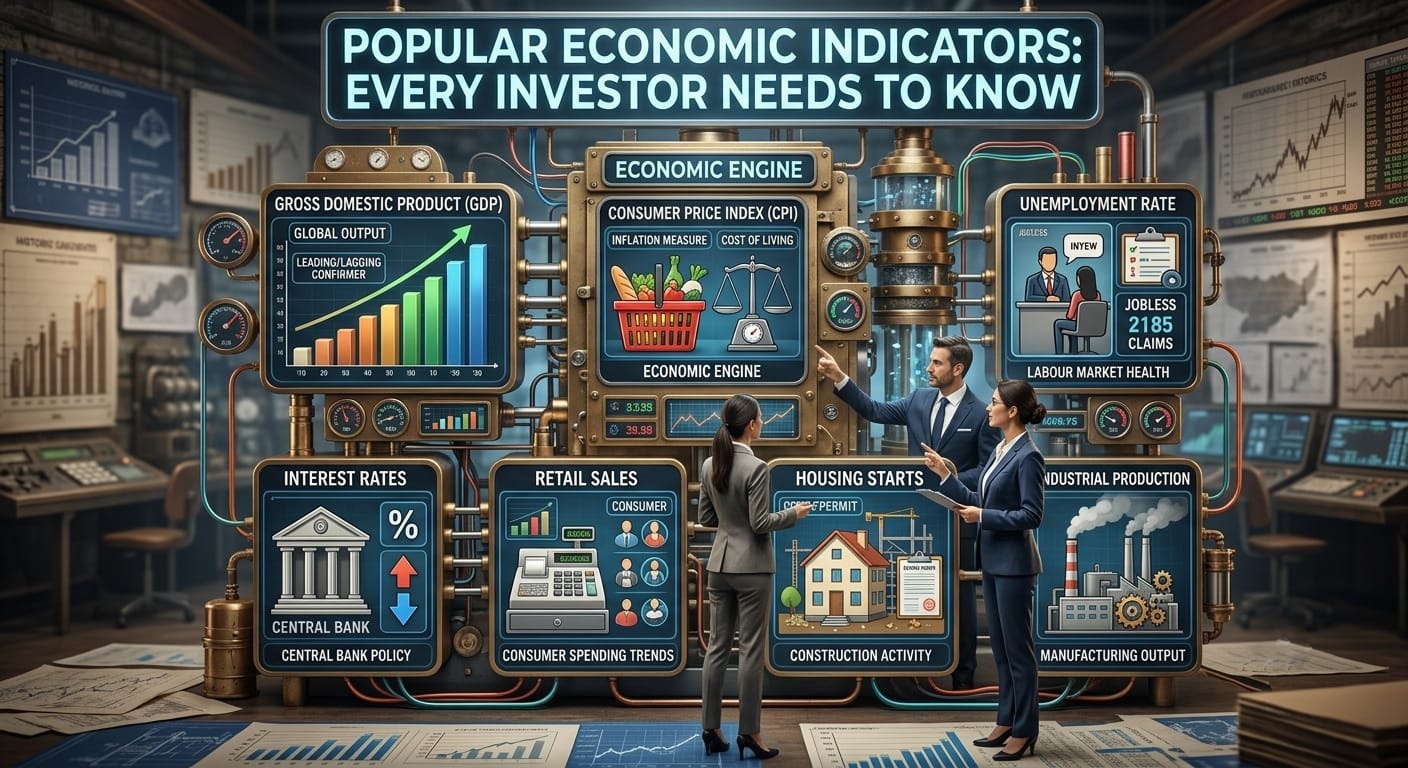
Economic Indicators for Investors in India help explain why stock prices fall even when a particular company is doing well and why the Reserve Bank of India changes interest rates.
Economic Indicators for Investors provide valuable insights into the country’s economic health and help investors make informed long-term investment decisions. While investing for the first time, most people don’t realize that stock markets are not just about individual companies, they are about the economy the companies are in.
When people in an economy are able to spend freely, businesses do well, but when the economy slows down, corporate profits get impacted. Understanding this connection helps you invest better.
To understand the economy, economic indicators play a vital role. These are regularly published, widely talked about numbers that tell you whether things are heating up, cooling down or somewhere in between. Once you know what to look for, reading the news becomes less confusing.
This article will help you decode some of the most important economic indicators with a focus on how they work in the Indian context.
Let’s start with GDP
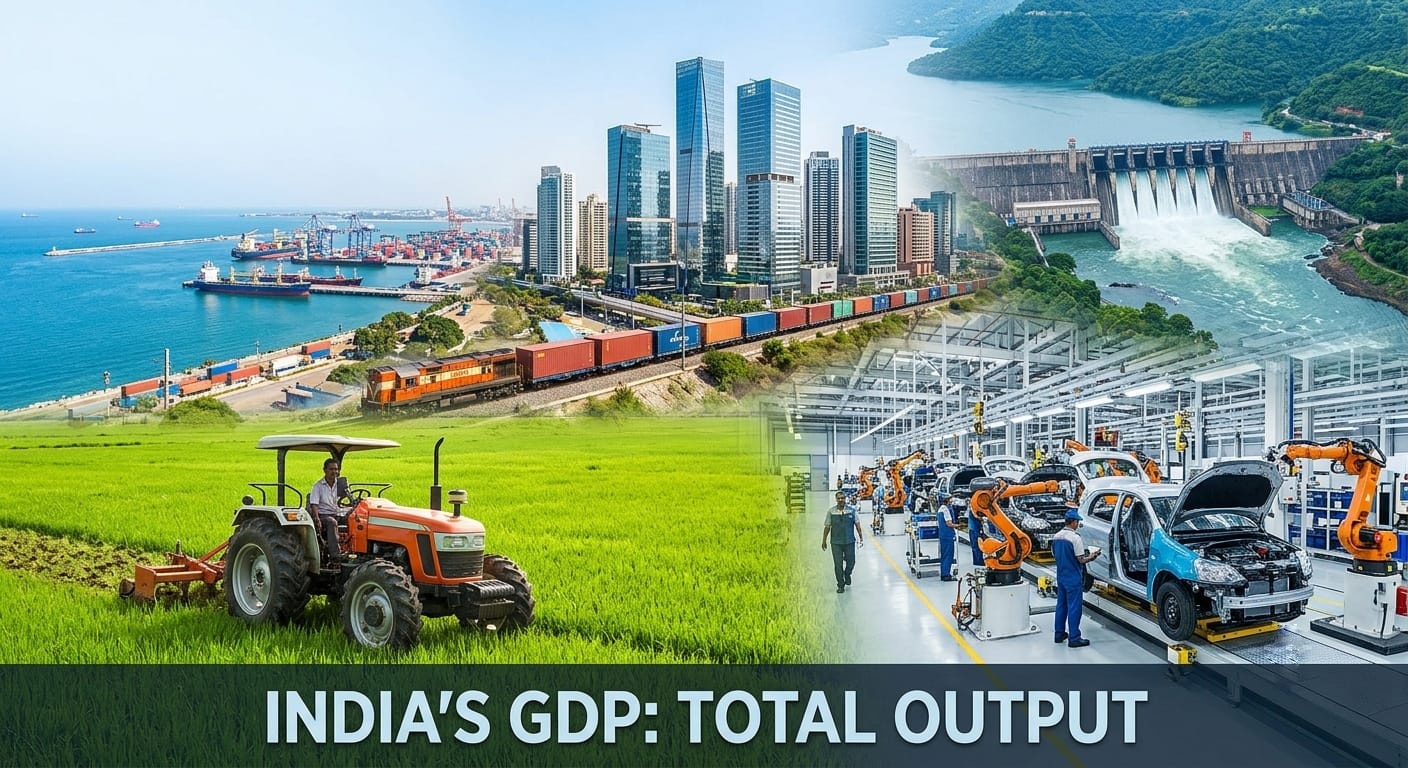
1. GDP – Among all the Economic Indicators for Investors, GDP is one of the most important because it measures the overall growth of the economy. Gross Domestic Product — is the grand total of everything an economy produces. GDP measures the market value of all final goods and services produced within India’s borders. Every product manufactured, every service provided, every rupee of economic activity gets counted into it. It’s the best single measure we have of how the economy is doing.
When GDP is growing steadily, businesses do better, people earn more, and corporate earnings follow. When GDP shrinks or shows signs of slowdown, markets tend to behave negatively. While GDP and corporate earnings are generally correlated over the long run, stock markets often price in future expectations rather than current GDP numbers.
GDP has four main components and understanding them helps you identify which part of the economy is contributing more at any given time:
i. Consumer spending- When people spend more, demand for goods increases which, in turn, benefits businesses.
ii. Business investment- This includes money spent on factories, equipment and technology. High investment levels suggest that businesses are confident about the future.
iii. Government spending- This includes spending on infrastructure, services and welfare. Government increases spending when there is a slowdown to keep the economy functioning.
iv. Net exports- Net exports refers to what India is selling minus what it is buying. A positive net export adds to GDP while a negative net export is deducted from GDP.
2. Inflation – Inflation is another key component of Economic Indicators for Investors in India, as it directly affects purchasing power, interest rates, and corporate profits. We all know inflation, we have all felt it, and we all think that inflation is bad, but a little bit of it is actually good. A little inflation reflects that the economy is growing and people are ready to pay a little more, which indirectly means they are earning better. The problem arises when prices rise faster than wages. In such a case, people are able to buy fewer commodities with the same money, which becomes a problem.
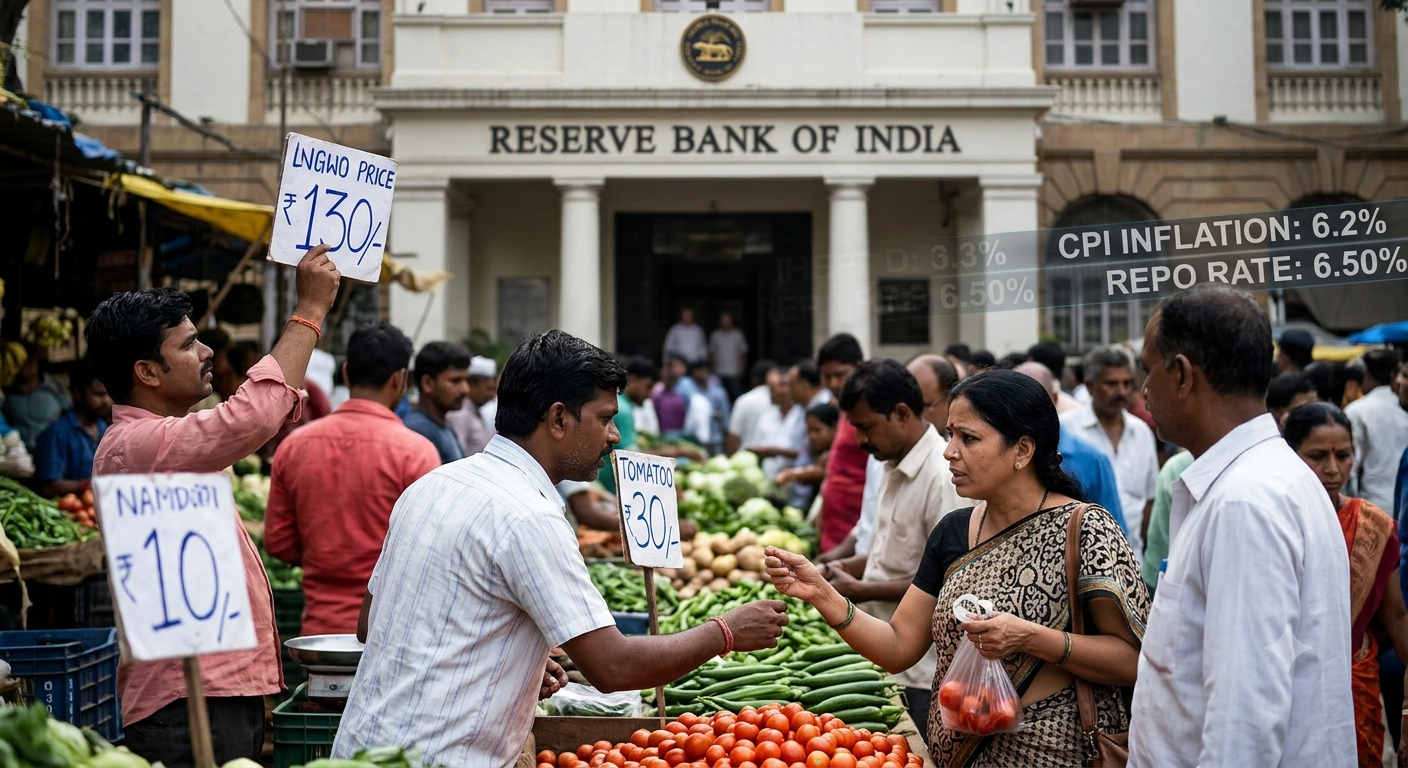
The RBI aims to keep CPI inflation at 4%, with a tolerance band of 2% to 6%, under India’s inflation-targeting framework. If inflation consistently moves outside this range, the RBI may raise or lower interest rates to bring it back within the target band while supporting sustainable economic growth.
i. CPI – The Consumer Price Index tracks the cost of a typical basket of goods and services like food, transport, housing, etc. Reserve Bank of India watches this very closely. The RBI tries to keep CPI inflation within a target band, and when it drifts outside the band, a policy change is done.
ii. WPI – The Wholesale Price Index measures price changes at the start of the supply chain, before goods reach the shelves. WPI is not widely tracked while making policy decisions, but it can give you a hint of upcoming inflation which may fall on end customers.
3. Interest Rates – If inflation is a problem, then one of the solutions is interest rates. This is the first tool Reserve Bank of India reaches for when inflation data goes out of their target band. The RBI’s Monetary Policy Committee meets regularly to decide whether to raise, cut, or hold rates. Their key tool is the repo rate, which is the rate at which commercial banks borrow from the RBI.
When the RBI raises the repo rate, borrowing money becomes more expensive across the whole economy. Home loans cost more. Business loans cost more. Consumers spend less. Growth slows down and so does inflation. When the RBI cuts rates, the reverse happens—borrowing gets cheaper, investment picks up, and spending increases.
For investors, rate decisions matter a lot. Rate cuts are usually good for the equity market because they reduce the cost of capital for businesses and make stocks more attractive compared to fixed-income investments. Rate hikes can do the opposite. Markets often react positively if cuts support growth, but the reason behind the cuts also matters (for example, cuts during a severe recession may not immediately boost stocks).
4. Industrial production – The Index of Industrial Production (IIP) measures output across manufacturing, mining, and electricity generation. It’s a useful real-time check on economic activity, particularly for sectors that make physical products.

A strong IIP shows that factories are running at capacity and demand is healthy. A declining number often signals that businesses are pulling back, which can be an early warning of broader economic weakness before it shows up in GDP data.
5. Purchasing Managers’ Index (PMI)– PMI is one of the earliest indicators of economic activity. It measures business activity in the manufacturing and services sectors by surveying purchasing managers about new orders, production, employment, inventories, and supplier deliveries.
PMI is published every month and is considered one of the earliest indicators of economic health. A reading above 50 indicates that business activity is expanding, while a reading below 50 suggests contraction. Since it is released before GDP or industrial production data, investors often use PMI to gauge the direction of the economy well in advance.
For example, a consistently rising manufacturing PMI may indicate stronger industrial activity and improving demand, while a weakening services PMI could suggest slower growth in sectors such as banking, hospitality, and retail.
6. Employment– Employment figures tell you something which neither GDP nor inflation can. They tell you whether people are actually doing well or not. When businesses do well, they pay better salaries, which in turn leads to more spending, and this is how the economy functions in a cyclical manner. If GDP looks good but there is joblessness in the economy, then households will spend less, which will drag the economy down. Job data is usually tracked to understand the economy and should be read in context, not in isolation.
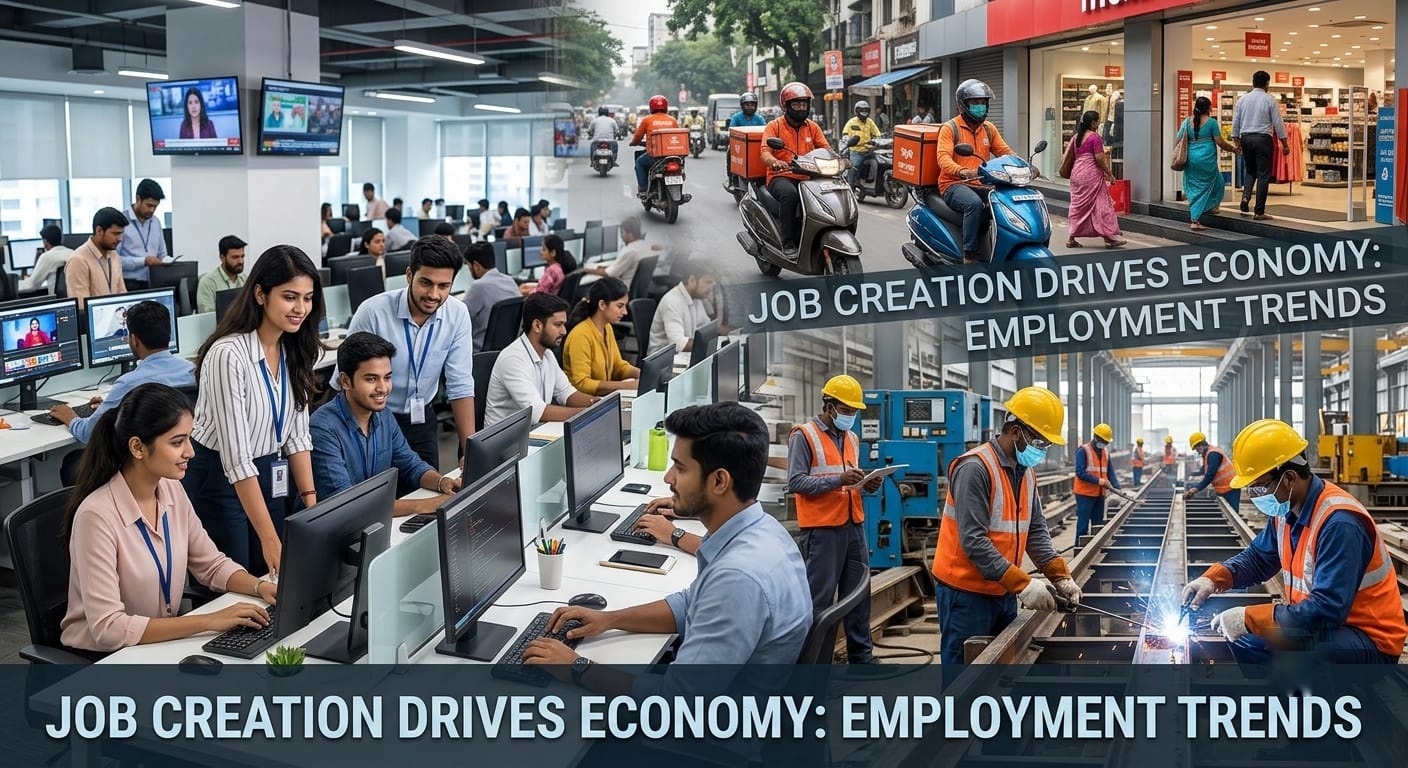
In India, there are multiple sources that track employment data. Centre for Monitoring Indian Economy (CMIE) releases unemployment data on a monthly basis, which is widely used by investors and analysts. The government also releases the Periodic Labour Force Survey (PLFS), which gives a detailed picture of employment trends across urban and rural India.Investors should look at employment trends along with other indicators. For example, if GDP is growing but unemployment is also rising, it could mean that growth is driven by automation or capital-intensive industries rather than job creation. This kind of growth may not result in higher consumer spending, which could affect sectors like FMCG, retail, and consumer durables.
7. Fiscal Deficit – It basically tells us how much the government is borrowing. When the government spends more than it earns through taxes, it runs a fiscal deficit and has to borrow to cover the gap. Some spending is normal and even useful; funding major infrastructure projects, for example, can generate long-term economic returns.
But being on a large fiscal deficit on a continuous basis is something to worry about. The government is borrowing from the same place where businesses do, which results in competition for borrowing. This competition can crowd out private investment and add inflationary pressure. Investors watch the annual Union Budget of India closely for the government’s deficit target and whether it’s on track to meet it.
8. The current account and the rupee – Current account includes trade in goods and services along with income and transfers, the trade balance being biggest component. India imports more than it exports, partially because of its dependence on crude oil. This results in a current account deficit, which means more money flows out of the country than flows in from trade. When this deficit widens, it can put pressure on the rupee.
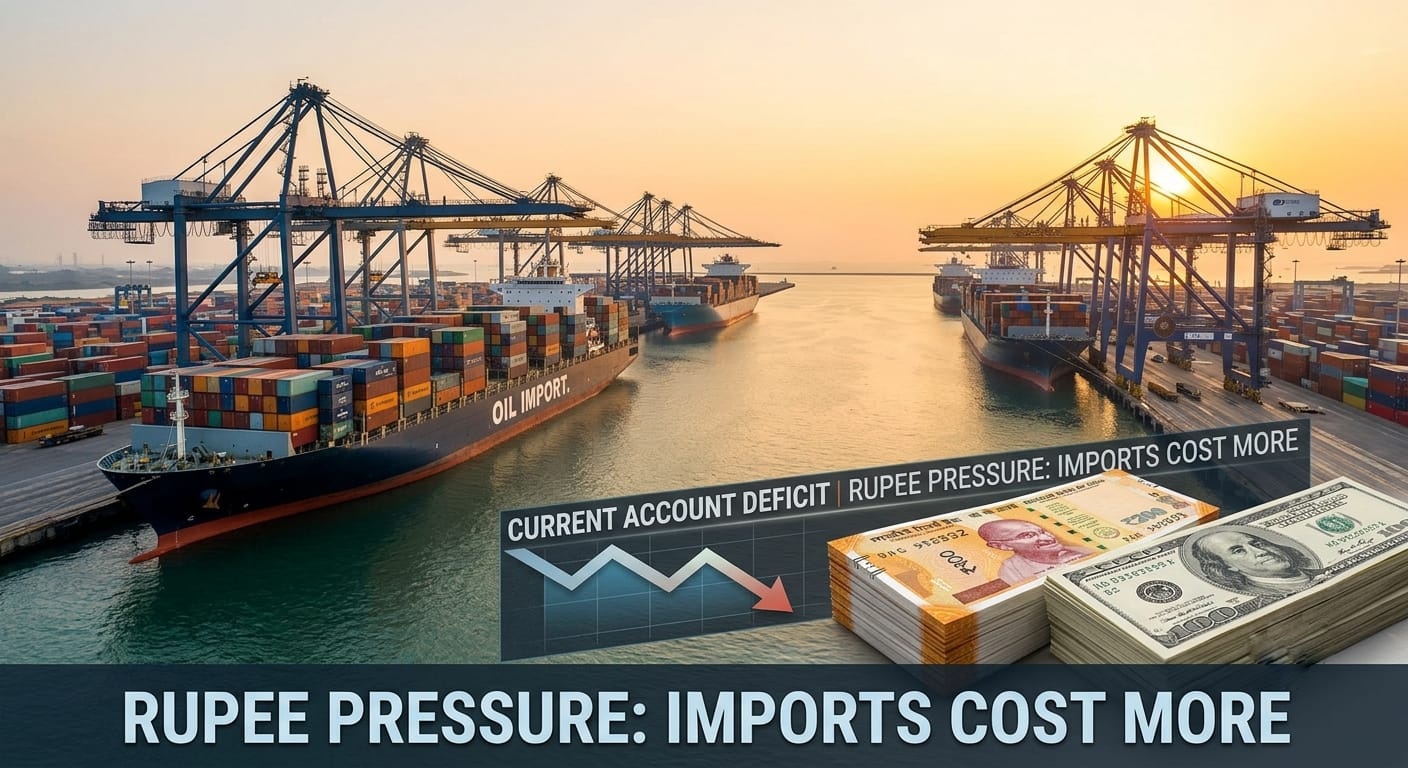
A weaker rupee has both advantages and disadvantages. On one hand, Indian exports become cheaper for foreign buyers, which benefits IT companies and other export-oriented businesses. On the other hand, imports, especially oil, become more expensive, which increases domestic costs and can push inflation up.
For investors with investments in sectors that are heavily dependent on imports or are export-driven, currency movements can significantly affect returns.
9. Economic cycles- Understanding Economic Indicators for Investors in India together, rather than in isolation, helps investors identify where the economy is in the business cycle. A single economic indicator can never tell you the whole story, and thus you need to be skillful enough to read all of them together and understand which cycle the economy is currently in. Economies tend to move through four recurring phases:
i. Expansion — In this phase, growth is picking up, employment is rising, corporate earnings are improving, and equity markets tend to perform well.
ii. Peak — Here, growth is still strong, but inflation is gradually increasing. The central bank may start tightening. Markets can get volatile.
iii. Contraction — Now, economic activity slows, earnings disappoint, and markets typically fall. This is where defensive positioning matters most.
iv. Recovery — Here, growth gradually resumes. Early-cycle sectors often move first, and opportunities emerge for investors who were paying attention during the contraction.
A final thought
By understanding Economic Indicators for Investors in India, investors can avoid reacting to short-term market noise and make more disciplined long-term investment decisions. You don’t need to become a macroeconomist to invest and generate returns. You just need to develop a basic understanding of these indicators. This will change the way you read financial news every day, and you will be able to analyse and make conclusions from it. Instead of reacting to headlines, you’ll start to see the broader picture they are pointing to.
Investors who tend to do well over the long run are the ones who understand what’s happening in the economy, stay patient through the cycles, and make decisions based on evidence rather than noise.
These indicators are your starting point for that kind of thinking.
Economic Indicators for Investors in India: How to use them
Economic indicators are meant to provide context, not trading signals. It is tempting to react every time inflation rises or GDP numbers surprise the market, but long-term investing is rarely about making decisions based on a single announcement.
Instead, investors should use these indicators to understand where the economy is in the business cycle and whether their portfolio is positioned appropriately. During periods of strong economic expansion, cyclical sectors such as banking, automobiles, real estate, and capital goods often benefit. During slower phases, defensive sectors like healthcare, utilities, and consumer staples may prove more resilient.
Rather than predicting short-term market movements, economic indicators should help investors make informed decisions, remain patient during periods of uncertainty, and avoid reacting emotionally to daily headlines. Over time, understanding the broader economic picture can lead to more disciplined investment decisions and better long-term outcomes.
Frequently Asked Questions
Q. How often are these economic indicators updated in India?
GDP data is released quarterly by the Ministry of Statistics. CPI and WPI are released monthly. IIP data comes monthly, usually with a 6-week lag. RBI’s repo rate decisions are announced every 2 months after MPC meetings.
Q. Where can Indian investors track these indicators?
You can track them on RBI’s official website (rbi.org.in), Ministry of Statistics (mospi.gov.in), and financial portals like Moneycontrol and Economic Times Markets.
Q. Should I change my investments every time an indicator changes?
No. These indicators are meant to help you understand the broader picture, not to time the market. Use them to make informed long term decisions, not short term reactions.
Q. Why are Economic Indicators for Investors in India important?
Economic Indicators for Investors help them understand economic trends, assess market conditions, and make informed investment decisions instead of relying solely on market sentiment.
For regular person finance related updates do follow us on Instagram and Facebook
For any queries do Contact Us