
When you start investing in mutual funds, you’ll often hear the advice: “Always check the factsheet before investing.” But what exactly is a mutual fund factsheet—and how do you make sense of all those charts, figures, and financial jargon without feeling overwhelmed?
Let’s break it down in simple terms so you can start making confident investment decisions.
What Is a Mutual Fund Factsheet?
A mutual fund factsheet is a one- or two-page summary published monthly by the fund house (AMC) that contains key details about the mutual fund’s performance, holdings, strategy, and risk level.
Think of it as the report card of a mutual fund.
Key Sections of a Mutual Fund Factsheet (and What They Mean)
1. Basic Fund Details
This section includes:
- Fund name
- Fund type (Equity, Debt, Hybrid, etc.)
- Fund category (Large-cap, ELSS, etc.)
- Benchmark (Nifty 50, BSE 200, etc.)
- Fund manager name and experience
Why it matters: Helps you understand the nature of the fund and compare it against similar funds.
2. Investment Objective & Strategy
A short paragraph about what the fund aims to do, e.g.:
“To generate long-term capital appreciation by investing predominantly in equity and equity-related instruments of large-cap companies.”
Why it matters: Tells you if the fund aligns with your goals (growth, income, preservation, etc.).
3. Performance (Returns)

Usually shown as returns over:
- 1 month, 3 months, 6 months
- 1 year, 3 years, 5 years
- Since inception
Compared against:
- Benchmark index
- Category average
What to look for:
- Is the fund consistently beating its benchmark and peers over the long term (3–5+ years)?
- Avoid judging based on short-term performance.
4. Net Asset Value (NAV)
- NAV = Price per unit of the mutual fund
- It changes daily based on market movement
Tip: A higher or lower NAV doesn’t mean better or worse performance. It just reflects the fund’s unit price.
5. Expense Ratio
The annual fee (in %) charged by the AMC to manage your money.
- Lower is better, especially in passive or debt funds.
- Actively managed equity funds may have slightly higher ratios.
Example: An expense ratio of 1.2% means ₹1,200 is charged annually on ₹1,00,000 invested.
6. Portfolio Allocation
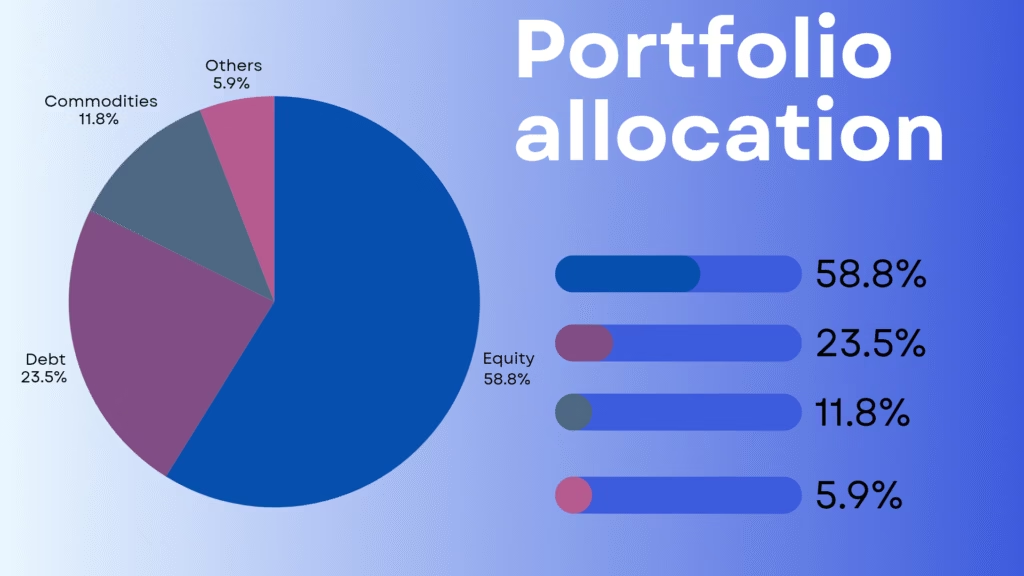
Breakdown of where your money is invested:
- Equity Funds: % in sectors like Financials, IT, Pharma
- Debt Funds: % in corporate bonds, government securities, etc.
Look for:
- Diversification – Avoid over-concentration in one sector.
- Top 10 holdings – Know the major stocks/bonds your fund holds.
7. Riskometer
A visual risk indicator with levels:
- Low
- Moderately low
- Moderate
- Moderately high
- High
- Very high
Why it matters: Helps match the fund’s risk to your own comfort level.
8. Exit Load
Fee charged if you redeem (sell) units before a specific period (often 1 year).
Example:
- 1% exit load if withdrawn before 12 months
- No exit load after 1 year
Tip: Plan your investments for the long term to avoid this fee.
9. AUM (Assets Under Management)
Total value of all investments in the fund.
- A higher AUM can mean investor trust, but bigger isn’t always better.
- For small-cap funds, extremely large AUM can be a challenge.
10. Fund Inception Date
Tells you how long the fund has been active.
Example Snapshot: Interpreting a Real Fund Factsheet
Let’s say you’re looking at a large-cap equity fund:
| Section | Sample Data |
|---|---|
| NAV | ₹52.34 |
| 3-Year Return | 16.7% CAGR |
| Expense Ratio | 1.12% |
| Benchmark | Nifty 100 |
| AUM | ₹12,500 Cr |
| Exit Load | 1% if withdrawn before 1 year |
| Riskometer | Very High Risk |
| Top Holdings | HDFC Bank, Reliance, Infosys |
What can you conclude?
- Solid 3-year performance
- Acceptable expense ratio
- Invests in blue-chip companies
- Suitable for long-term investors comfortable with high risk
Bonus: Red Flags to Watch For
- Consistent underperformance vs. benchmark and category
- High expense ratio without delivering excess returns
- Too concentrated portfolio (few holdings dominate)
- High churn rate (frequent portfolio changes)
Final Thoughts
A mutual fund factsheet may look technical at first glance, but once you know what to focus on, it becomes a powerful tool to:
- Compare funds
- Align with your investment goals
- Avoid costly mistakes
Take Action
- Download factsheets from official AMC websites or platforms like Value Research Online or Moneycontrol.
- Review the factsheet before you invest—not after.
Disclaimer
This blog is for educational purposes only and does not constitute financial advice. Mutual fund investments are subject to market risks. Please consult a SEBI-registered investment advisor before making investment decisions.
For regular personal finance related updates do follow us on Instagram and Facebook .
For any queries Contact Us